Driver of change: Using data to influence behaviour
-
89.8% of respondents would be interested in customised premiums based on driving behaviour
In the 2022-23 Global Consumer Study, we explored Property & Casualty insurance for the first time. Within this, we wanted to hear consumers' thoughts on road cover, from assessing their own driving abilities to considering data-driven discounts. Here's what we learnt from over 12,000 consumers...
Traffic regulations, driver licensing and mandatory motor insurance are standard practices to improve road safety. But, with World Health Organization[1] figures showing that approximately 1.3 million people die every year because of road traffic accidents, and a further 20-50 million suffer non-fatal injuries, further safety measures are needed.
These measures will come from a variety of parties, with governments, insurers and motor manufacturers all focusing on initiatives that will help to reduce road traffic accidents. While their approaches are markedly different, all are targeting the number one cause of road traffic accidents – driver error.
Studies show that at least 90% of road traffic accidents are caused by driver behavioural errors such as distraction, speeding, and alcohol impairment. As an example, a report from the US’s National Highway Traffic Safety Administration[2] found that driver error caused or contributed to 99% of the crashes it investigated.
Removing driver error
Legislation is a keyway in which governments are removing some of the causes of driver error. Alcohol limits, speeding penalties and bans on mobile phone usage are all helping to improve safety on the roads.
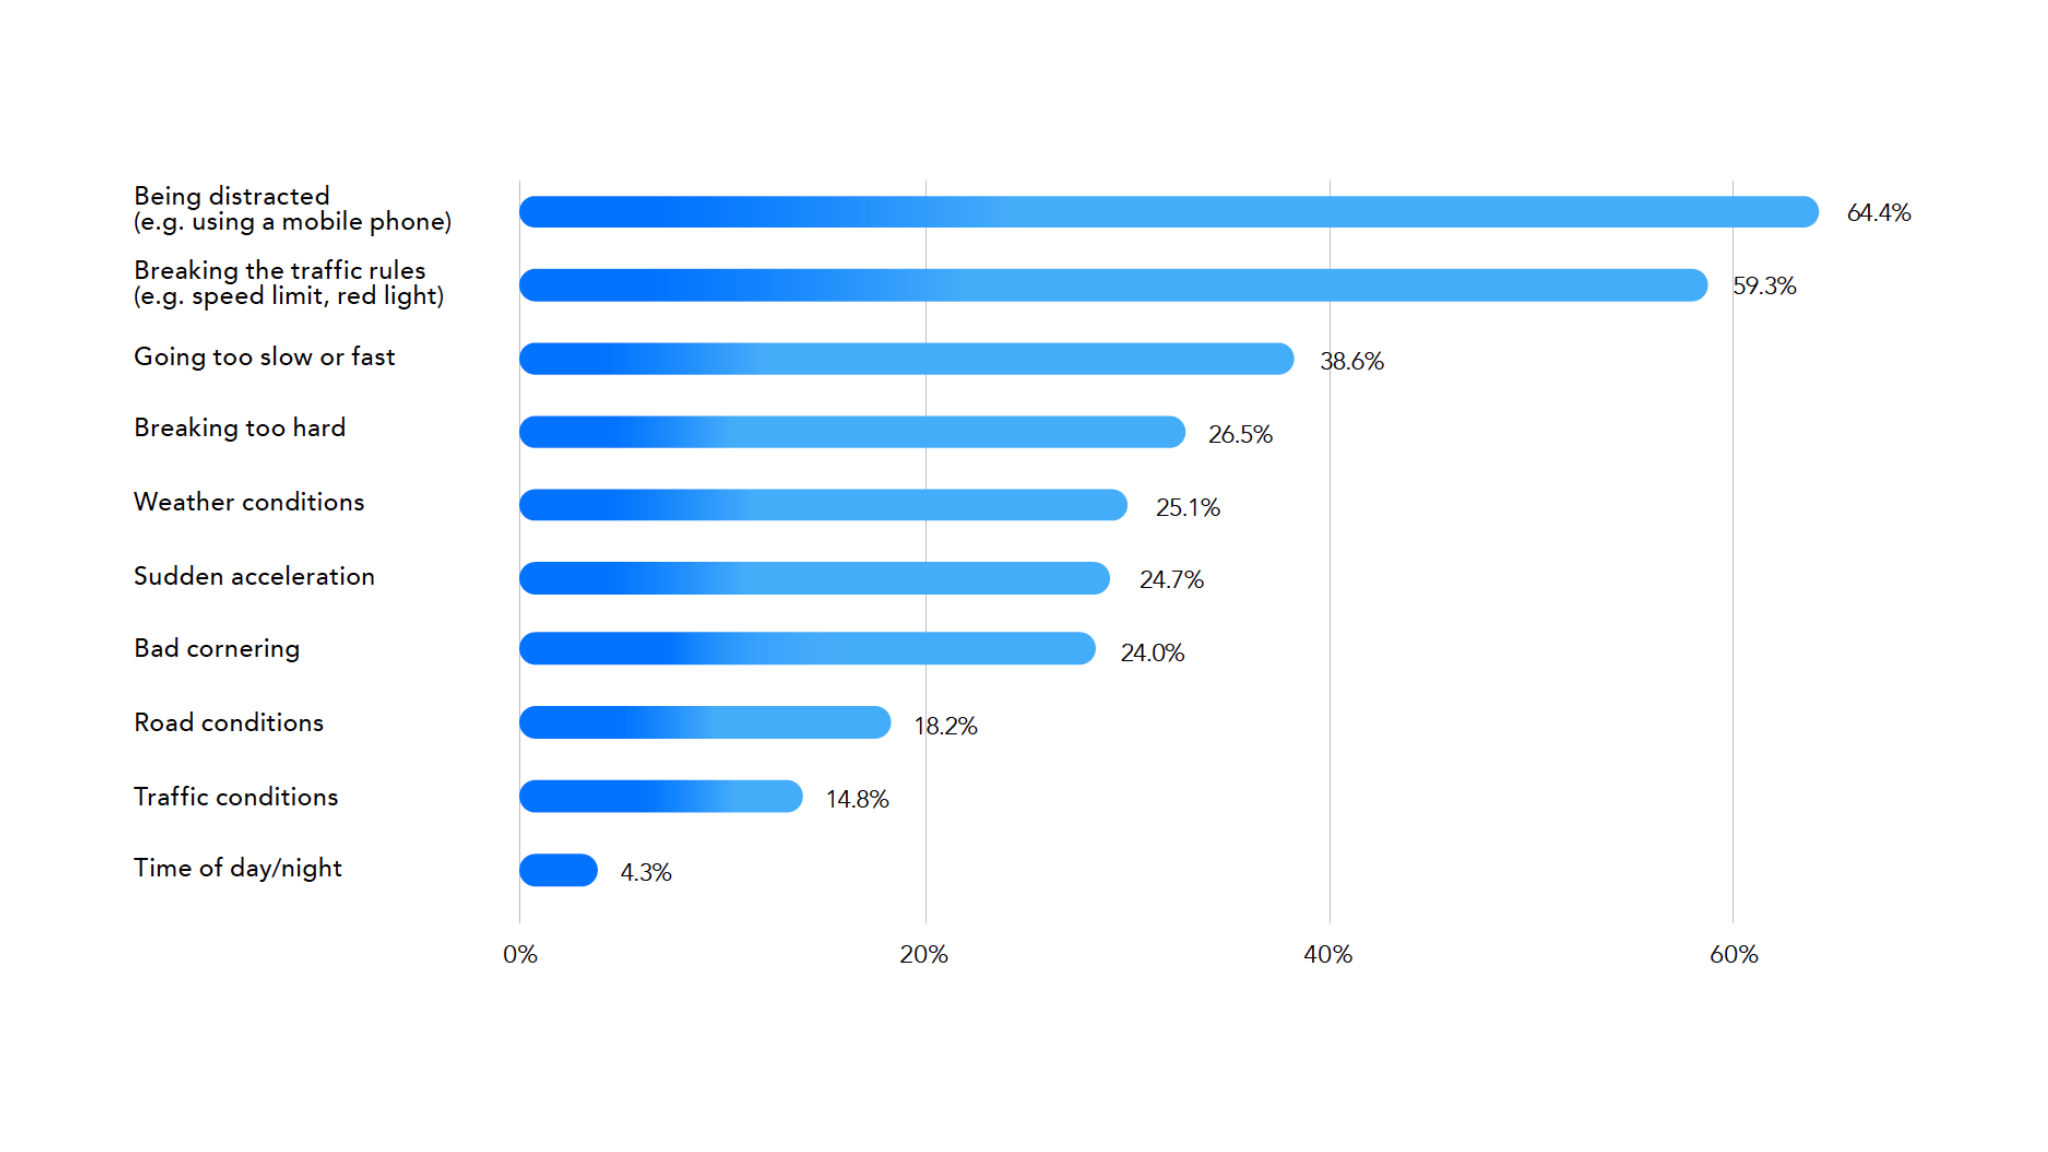
Our research indicates the message is getting out there. When asked to select the top three factors that would put a driver at most risk of having an accident, the top answer is ‘being distracted, for example using a mobile phone’, with this selected by 64.4% of respondents. Not far behind, at 59.3%, is ‘breaking the traffic rules’. In fact, of the 10 risk factors offered, the six that relate to driver error fall in the top seven. The only external factor to be rated above driver error is weather conditions, which was selected by 25.1% of respondents, putting it in fifth place (Figure 46).
Motor manufacturers are also helping to remove human error, developing advanced driver assistance systems (ADAS) to enable technology to override driver judgement. ADAS features such as adaptive cruise control, lane keep assist systems and electronic stability control are common in new vehicles, bringing significant improvements in safety.
Tests by the UK’s insurer-funded research centre, Thatcham Research, found that vehicles fitted with electronic stability control are 25% less likely to be involved in a fatal accident than those without it[3].
Changing behaviour
Insurers are also helping to drive improvements in road safety through the promotion of telematics. Several mainstream insurers offer telematics policies alongside mainstream car insurance policies such as Geico, Farmers, Admiral and RAC. Other new start-up and InsurTech brands specialise in telematics policies such as Lemonade and By Miles.
Although this technology doesn’t enhance vehicle safety itself, by sharing the data with the driver it can lead to changes in driving behaviour that will make them safer on the roads. Using data – and sometimes incentives – to nudge motorists to change their driving habits can be powerful, especially given their perception of their own capabilities behind the wheel.
When asked to rate their driving from 1 to 5, 86.5% of respondents consider themselves a four (42.4%) or a five (44.1%). That such a high proportion is above average is statistically impossible, but it also indicates that many drivers feel above any criticism, unless it is robustly grounded in data or sweetened with an incentive to change (Figure 47).

But take-up of telematics remains low, especially outside of segments that would struggle to obtain affordable motor insurance. A report from McKinsey & Company[4] found that it was a niche product in most markets and even among those that had taken to it – United States, Italy, South Africa – penetration rates were 20% or less.
Going mainstream
These figures are likely to have increased since the McKinsey & Company report, but telematics is still far from mainstream. To understand what it would take to tip the balance, we asked respondents which benefits they would be most interested in if their motor insurer invited them to install an analytics device on their vehicle (Q41.2a). The most popular option is car-related services such as free roadside assistance or theft alerts, which 52.6% of respondents say they’re very interested in, with vouchers and rewards for good driving in second place with 51.6% very interested. Combine the somewhat and very interested responses, and car related services remain in pole position (90.4%) with a customised price on car insurance based on behaviour in second place (89.8%). Being rewarded for good driving habits chimes with respondents’ perceptions of themselves as above average motorists.
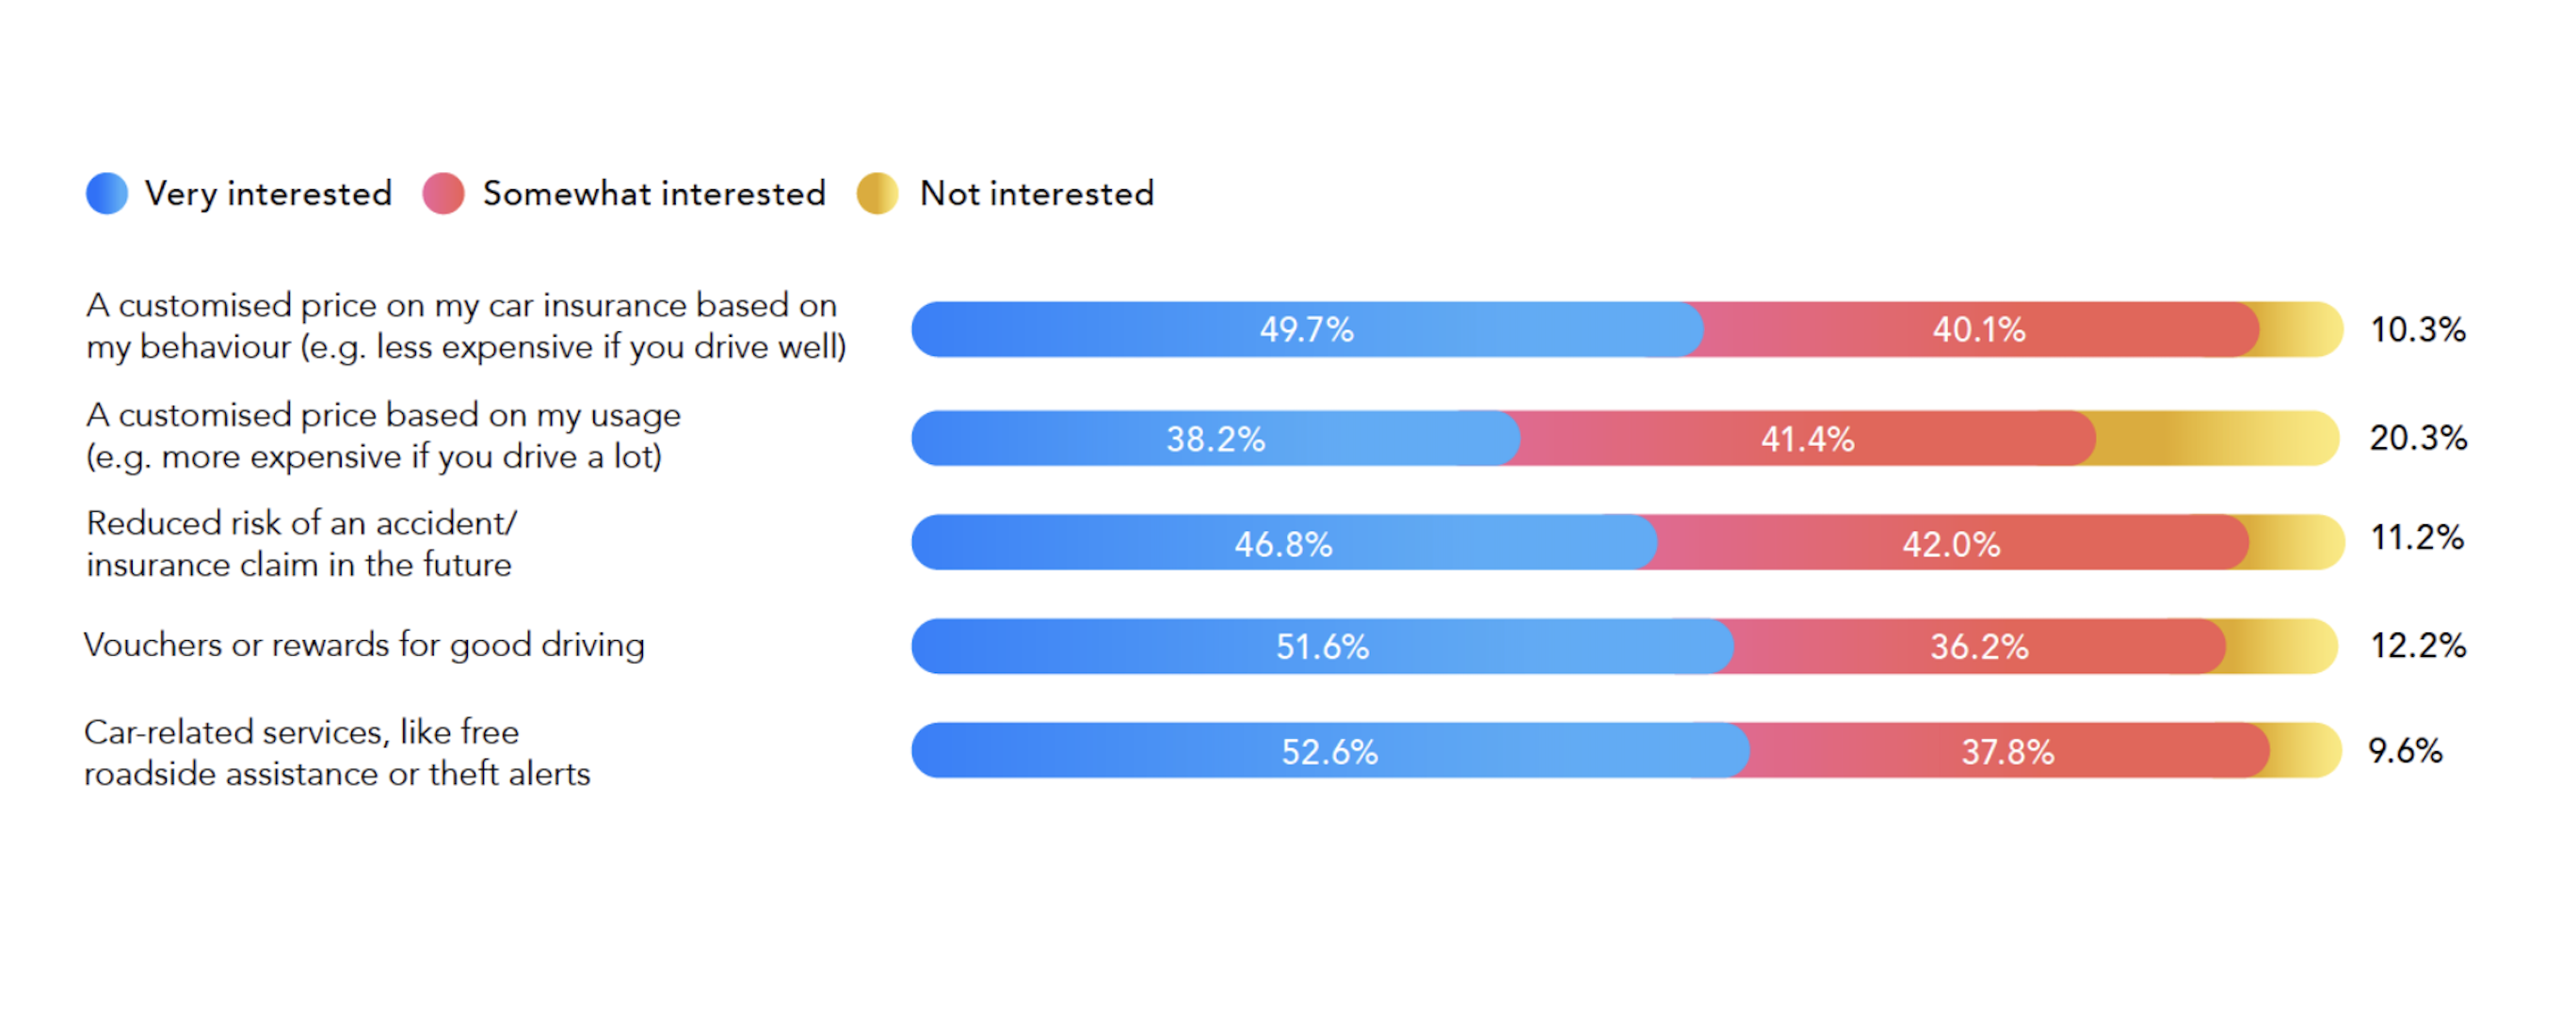
The option that is relatively less attractive to respondents is a customised price based on usage, where they will pay more if they drive a lot. One in five (20.3%) say they’re not interested in this, although 38.2% say they’re very interested.
We also asked what type of information they would like to receive if they were able to sync an app with their analytics device. This found that 65.6% would like to receive feedback on how they drive, so they could improve, with 37.9% wanting access to technical driving data and 34.9% information on their carbon emissions.
With this feedback from consumers and their appetite for analytics, insurers can create a deeper understanding of individual risk profiles, as well as reducing the claim loss ratios through faster and smart claim handling. Furthermore, ongoing analytics communications is an easy route to constant customer engagement. Engaged customers are more likely to be satisfied with the service, less likely to lapse and more likely to renew their business.
References:
[1] Who.int. 2022. Road traffic injuries. [online] Available at: https://www.who.int/news-room/...
[2] Hendricks, D. and Fell, J., 1999. The Relative Frequency of Unsafe Driving Acts: Summary. [online] One.nhtsa.gov. Available at: https://one.nhtsa.gov/people/i...
[3] Thatcham. 2022. Driver Assistance - Thatcham. [online] Available at: https://www.thatcham.org/what-...
[4] McKinsey & Company, 2022. TELEMATICS: POISED FOR STRONG GLOBAL GROWTH. McKinsey Center for Future Mobility.